The Effect of the COVID-19 Pandemic on Glove Stock Returns in Malaysia
by Bryan Lim Wee Choong, University of Nottingham Malaysia
Abstract: The COVID-19 pandemic came into existence in late 2019 and, in 2020, had spread to every corner of the earth. While many suffered due to the pandemic, there are some who have prospered as a result of the pandemic, namely the Malaysian glove companies. This paper uses an event study methodology to analyse the impact the global pandemic has had on glove stock returns. The event study methodology produced significant results and shows that the pandemic has indeed positively affected glove stocks. A similar methodology is also carried out on the same glove stocks during the SARS outbreak in 2003 and it was found that the World Health Organization’s global alert regarding the outbreak had an insignificant impact on the glove stocks. The abnormal returns that were computed by the event study methodology were regressed against the change in the total number of global and local COVID-19 cases to find any relationship between the variables. The results presented were significant, but the relationship is unexpected.
1. INTRODUCTION
No other word was searched for more than “Coronavirus” on Google throughout 2020 (Google Trends, 2020). This is in reference to the coronavirus (also known as COVID-19) pandemic that has taken the world by storm. The virus was first discovered in China in December 2019 and has since spread globally like wildfire to every corner of the earth. By March 2020, the virus has claimed about 4,000 lives as symptoms of the illness could be severe, and this has led the World Health Organisation (WHO) to classify the outbreak as a global pandemic. Despite WHO’s warnings, the lack of an effective vaccine as well as loose lockdown regulations has caused the virus to spread rapidly; and by September 2020, over a million people have lost their lives to the virus (Worldometer, 2020).
Due to the highly contagious and hazardous nature of the virus, many governments were forced to implement lockdowns in their respective countries to ensure citizens stayed home to prevent the virus from spreading further. This has affected the economy as per the International Monetary Fund’s (IMF) projection on global economic growth in 2020 to fall to -3% which is the worst recession the world has seen since The Great Depression (IMF,2020).
The virus arrived on Malaysian shores in January 2020. However, the virus was still fairly well contained until March 2020, where daily cases started hitting triple digits which forced the government to implement a Movement Control Order (MCO) in the country in order to prevent the virus from spreading. Apart from essential services (such as banking, health, transport etc.), all premises, both private and public, were to be closed. A survey was conducted by the Department of Statistics in Malaysia to determine the impact the MCO has had on both individuals and firms. The survey’s results showed that 67.8% of firms (mostly made up of small and micro firms) were not making any revenue when the MCO was implemented. The survey also showed almost 50% of self-employed individuals as well as 23.8% of employers lost their jobs due to the lockdown (2020).
The pandemic has also caused the stock market in Malaysia to plummet. The FTSE Bursa Malaysia Kuala Lumpur Composite Index (FBM KLCI) is a capitalisation-weighted stock market index which consists of the top 30 companies (based on market capitalisation) listed on the Malaysian stock exchange (Bursa Malaysia). The FBM KLCI dropped significantly as the pandemic worsened and reached its lowest point since 2010 in March 2020, as shown in the graph below. This suggests that the majority of listed companies have suffered due to the pandemic.

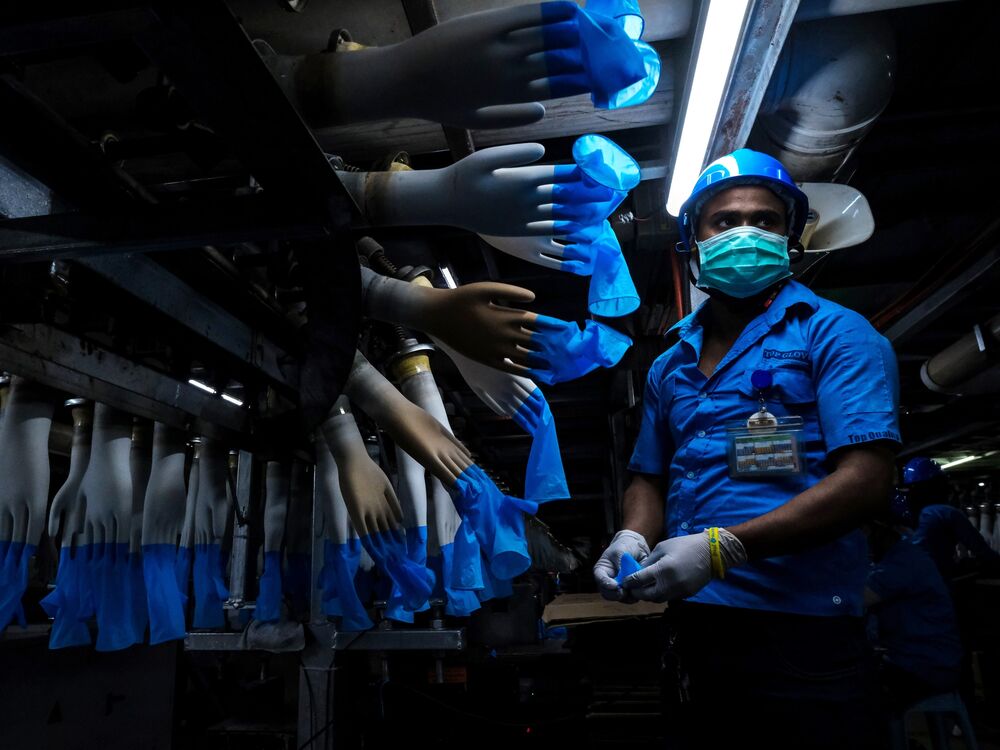
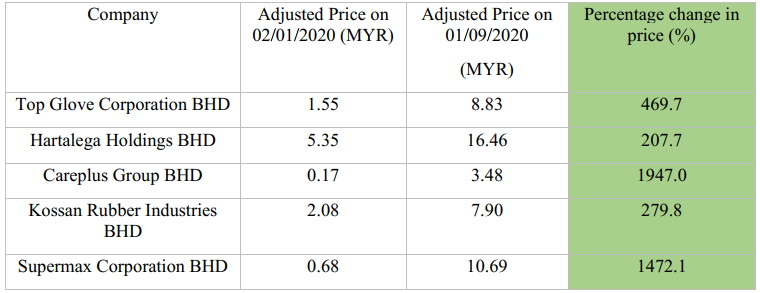
However, not all is gloom and doom as there are those who have benefited a great deal due to the pandemic, namely the Malaysian glove companies. Top Glove, which is the largest glove company in the world, has seen its share price grow nearly six times fold year-to-September 2020 during the pandemic. Top Glove is not the only company to see such large numbers as other Malaysian glove counters have also seen a boom in share prices as seen in the table below.
New standard operating procedures have caused the demand for gloves to increase substantially, not only within the healthcare sector but also within other sectors as a precautionary measure to avoid rapid spread of the virus. The virus has hit every country, causing the demand for these gloves to increase everywhere; and the Malaysian glove counters have majorly benefited from it.
There are multiple research papers that have examined how COVID-19 has affected the economy and stock market in general. However, studies on the effect of COVID-19 on the stock prices of a specific sector have been scarce. We aim to quantify the impact of the pandemic on the glove company stock prices listed on the Malaysian stock exchange. We will also compare the impact, contrasting how the SARS outbreak in 2003 affected the glove companies that were traded on the stock market at that time to see if pandemics impact glove companies positively. This can fill the gap in existing literature–as there are no studies comparing stock prices of a specific sector of the two pandemics.
The method which will be used in this paper would be the event study methodology to capture the effect of the pandemic on the glove stock prices. The companies which will be analysed are displayed in Table 1. The event study methodology would be appropriate as it allows researchers to analyse the impact of a specific event on the performance of firms. The event in question would be the COVID-19 pandemic. The date that will be used for the event study would be the date the WHO announced the COVID-19 outbreak as a global health pandemic, as the day marked the start of a global alert and had a significant impact. Similarly, we will use the date the WHO issued a global alert regarding the SARS outbreak for the event study on the impact of the SARS outbreak. The study will produce abnormal returns which may be further analysed by regressing it with the day-to-day change in the total number of positive COVID-19 cases both locally and globally (separately) to observe if these statistics have a significant impact on the abnormal returns of the glove stocks.
In the next section, we will be reviewing the existing literature that is able to complement our study as well as support our proposed methodology. The subsequent sections which follow are; Section 3 which will describe the methodology that will be used as well as the data and variables collected for the study; Section 4 which reports the results obtained; Section 5 to discuss the findings; Section 6 to conclude the study.
2. LITERATURE REVIEW
As mentioned earlier, the aim of the study is to study the impact of the pandemic on the glove stock prices. Before moving into more specific studies, a research conducted by Adda (2016) attempted to study the relationship between economic activity and the spread of viral diseases by using high-frequency data. The study has shown that diseases spread as a result of unforeseen consequences of economic activity; policies enforcing laws on social distancing have helped in containing diseases. However, the study also found that these measures can be costly to the economy and should be imposed strategically. As a result of lockdown measures in Malaysia, the GDP growth rate in Q2 of 2020 was -17.1% which supports the aforementioned findings. However, these findings did not further elaborate on how glove stocks managed to soar in prices. Lee and Brahmasrene (2018) conducted a study to determine the relationship between macroeconomic variables and stock prices in Korea. Their study did not show any substantial evidence in respect to external shocks influencing domestic stock price dynamics. The study showed that macroeconomic variables such as GDP or exchange rate are inapt to predict glove stock prices despite both being heavily affected by the pandemic.
Moving on to studies that specifically study the impact of the COVID-19 pandemic, Baker et al. (2020) have conducted a study which examined the U.S. stock market behaviour amidst the COVID-19 pandemic. They found that development in the COVID-19 situation had been the main contributor to the volatility in the stock market, during their period of study (January 2020 to April 2020). The study also compared the reaction of the stock market during other pandemics and found that none of these outbreaks affected the U.S. stock market as strongly as COVID-19 had. From another perspective, Singh et al. (2020) examined the effect of the pandemic on the stock markets of G-20 countries by using an event study methodology. The results showed significant negative spikes for the countries regardless of its development status. Bash (2020) also found similar significantly negative results with their study on 30 different countries.
In contrast to the studies above, a study conducted by Alam (2020) on the stock market response in India yielded contrasting results where the average abnormal returns (AAR) were positively significant after using an event study methodology as well. The study showed negative AARs initially; however, this was prior to the announcement of protective measures by the Indian government. The significance of a lockdown or any form pf precautionary measure to curb the pandemic is apparent in the stock market and hence should also be considered in our study. However, it is important to take into consideration the fact that the study used stock prices of randomly chosen firms in India, therefore, results may not apply to that of our study.
To further reinforce our hypothesis, we look at a study that has analysed the impact of the pandemic on specific sectors. He et al. (2020) used empirical analysis to study the effect of the pandemic on the Chinese stock market while also dividing the firms by sectors. The results showed that different sectors were affected differently as a result of the outbreak and healthcare (the sector which glove companies fall into) remained resilient. As mentioned earlier, the COVID-19 pandemic is not the first global health crisis that the world has seen and hence we can take studies conducted on previous pandemics, namely SARS to support our study. Loh (2006) examined the effect of SARS on airline stocks across 5 countries. The study showed the variation of the stock prices was similar in the periods that were studied hence rendering the statement that the SARS had a negative impact on the airline stocks null. However, airline stocks were found to be more sensitive to news about the outbreak compared to non-aviation stocks hence, using the date of the WHO announcement would be a suitable event for our study. A study conducted by Chen et al. (2006) resembles that of ours the most as the study examined a specific sector in a specific country, specifically on Taiwanese hotel stocks. The event study methodology used yielded significant results where it showed that the pandemic has negatively impacted the hotel stocks. Considering the significant impact of the SARS pandemic, we will also examine the impact of SARS on the glove stocks and compare with the impact of the COVID-19 pandemic to see if the surge in glove stock prices is specific to COVID-19 or would have happened in any pandemic.
3. METHODOLOGY
As mentioned in the introduction, the method we propose to conduct this study is the event study methodology (ESM), a method that has been frequently used to quantify the effects of an event on a variable. The said methodology allows us to isolate a specific date and analyse its impact on stock prices. The versatility of the event study methodology also allows us to analyse the impact of a long-term event such as the COVID-19 pandemic which still affects a large percentage of countries up to this day. In the following subsections, we will proceed with the description of steps to be taken for an event study.
3.1 Estimation and Event Window Identification
The first step in the ESM is to identify the event which we plan to analyse. The event in question is the COVID-19 pandemic, however, the study requires a specific date of the event to analyse its impact. Although the outbreak was first reported back in December 2019 in China, the virus had globally begun penetrating into other parts of the world a period of time later. Hence, in our study we will be using the date the World Health Organisation (WHO) announced the virus outbreak as a global pandemic as our event date which is essentially the start of our event window. The impact of such a significant announcement from the WHO should be apparent in our results. Our study period comprises 150 trading days after the announcement to capture the effect of the pandemic. The last 75 trading days of the period will be analysed separately from the first 75 trading days for further analysis regarding the extent of the impact of the pandemic. The window consisting of the last 75 trading days of the event window will be addressed as the “post-event window”. Abnormal returns will be computed for the entire 150 trading days of our event window where we predict the first 75 trading days to have slightly more significant results as compared to the last 75 trading days.
In order to obtain the abnormal returns of the firms we are analysing, the expected returns of the firm (if the event had not occurred) would need to be calculated as well. Having said that, we will also use 150 trading days prior to our event in order to obtain the estimates used to compute the abnormal returns in the event window. The timeline for our analysis is as shown below:

The same ESM will also be conducted on the same firms (if available) during the SARS outbreak in 2003. We will use the date that the WHO issued a global alert regarding SARS as the event (WHO,2003a). Our event window for the SARS outbreak will be a smaller sample than that of the COVID-19 pandemic as both diseases vary significantly in terms of its global impact. In addition, the WHO declared the SARS disease to have been contained on the 5th of July 2003 (WHO, 2003b), which is less than 4 months after the alert. Malaysia had only experienced 5 confirmed cases of SARS (WHO, 2015); hence, we expect the impact on stock returns to be smaller. We will use 100 trading days prior to the event as our estimation period and only analyse the 50 trading days after the alert to test if the alert affected stock returns significantly. Similarly, we will also split the event period into two equal windows to analyse the impact of the alert from the WHO.

3.2 Research Model
As mentioned earlier, in order to obtain the abnormal returns, estimates are required to predict the normal (expected) returns of the firms. The respective firms’ stock returns will be regressed against the market returns index in order to control for the market’s movements. In this context, the market returns index refers to the FTSE Bursa Malaysia Kuala Lumpur Composite Index (FBM KLCI) which was introduced earlier. The estimates will be obtained from running an Ordinary Least Squares (OLS) regression to obtain the parameters. The equation, followed by the definition of the variables, are shown below:
(1) ![\[R_{j,t}=\beta_{0_j}+\beta_{1_j}mktr_t \]](https://econsilience.ameuglobal.com/wp-content/ql-cache/quicklatex.com-e933cefd46f9a282cc28adfcbd2d39a6_l3.png "Rendered by QuickLaTeX.com")
where Rj,t is the returns of stock j on day t, β0,j and β1,j are the regression parameters, and mktrt is the market index on day t.
The coefficient estimates obtained from Eq (1) will then be used to predict the stock returns of the firms in the event window. The computed values will be recognized as the expected returns of the stock, where it is an indicator for the returns obtained under “normal” circumstances, had the event not occurred. Once the expected returns of the stocks are computed, the abnormal returns of the stocks can be calculated using the formula as shown below:
(2) ![\[AR_{j,t}=R_{j,t}-ER_{j,t} \]](https://econsilience.ameuglobal.com/wp-content/ql-cache/quicklatex.com-79c390e76298f7317e9f804780d6dc99_l3.png "Rendered by QuickLaTeX.com")
where ARi,t is the abnormal returns of stock j on day t, and ERi,t is the expected returns of stock j on day t.
The abnormal returns are then summed up in order to obtain the cumulative abnormal returns for each firm that was obtained during the event period. With the cumulative abnormal returns (CAR), we conduct a two-tailed t-test on the value to test our hypothesis and check for statistical significance in abnormal returns. The t-test will be conducted as follows:
H0: CAR = 0; The COVID-19 pandemic had no effect on the glove stock returns.
H1: CAR ≠ 0; The COVID-19 pandemic affected glove stock returns and CAR is statistically different from 0.
The decision rule is to reject null hypothesis if t-statistic computed is greater than the critical value at a 5% significance level.
![\[\text{t-statistic}=\frac{1}{\sqrt{n}} \displaystyle\sum_{i=1}^n CAR_i ,\]](https://econsilience.ameuglobal.com/wp-content/ql-cache/quicklatex.com-8b398e10929178d02098500c59d72869_l3.png "Rendered by QuickLaTeX.com")
Where n is the number of observations, and CARi is the cumulative abnormal returns for firm i.
We hypothesise the CAR to be statistically significant for the event window as it is evident that the COVID-19 pandemic has affected the stock returns for glove manufacturers in Malaysia. We plan to repeat the process to analyse the impact of SARS on the Malaysian glove stock returns and compare the statistical significance of the abnormal returns in both models. We also expect the positive value on abnormal returns to be statistically different from zero for the glove stocks during the SARS outbreak.
While our proposed method is to verify if the announcement by the WHO has affected the stock returns, it is already prominent that the COVID-19 pandemic has affected the stock returns just by looking at the price movements in that period. Further analysis on the abnormal returns for the glove stocks will be conducted.
3.3 Analysing Abnormal Returns
The statistic regarding COVID-19 which garners the most attention everyday all around the world would be the number of infections and deaths caused by the virus. If there was a way to quantify the effect the pandemic has had on the world, the easiest way would be to look at the aforementioned statistics. This leads us to our next model, where the abnormal returns (which are statistically significant) of the glove stocks will be regressed (using the ordinary least squares method) against the confirmed positive COVID-19 cases in Malaysia. The abnormal returns will also be regressed against the daily number of confirmed positive cases of COVID-19 worldwide to see which is more significant.
3.3.1 Model Specifications
Both the regressions mentioned above will use the same equation for the regression analysis as follows:
(3) ![\[AR_{t,j}=\beta_0 + \beta_1 ln \text{ } localcases_t \]](https://econsilience.ameuglobal.com/wp-content/ql-cache/quicklatex.com-c40466205a57baca6046841d66d3771f_l3.png "Rendered by QuickLaTeX.com")
(4) ![\[AR_{t,j}=\beta_0 + \beta_1 ln \text{ } globalcases_t \]](https://econsilience.ameuglobal.com/wp-content/ql-cache/quicklatex.com-fc4050173bc08e18101c22bbc339cf80_l3.png "Rendered by QuickLaTeX.com")
Where ARt is the abnormal returns of glove stock j on day t, ln localcasest is the natural logarithm of the change in total number of confirmed cases on day t locally, and ln globalcasest is the natural logarithm of the change in total number of confirmed cases on day t globally.
In order to correct for heteroskedasticity that may be present in the model, robust standard errors are used in the OLS regression. Considering the fact that we are only using one explanatory variable, we do not expect the model to have large explanatory power. Above all, the focus of the regression would be on the coefficients and whether or not they are statistically significant. If the coefficient for the number of cases are positive and statistically significant, we can affirm that the abnormal returns of the glove stocks are a function of the number of confirmed positive cases of COVID-19, both locally and globally. The significant results could help explain the difference of the abnormal returns (if any) between the glove stocks in the COVID-19 and the SARS pandemics.
3.4 Data Source
There are currently only 5 glove companies that are listed in the healthcare sector on Bursa Malaysia, namely:
- Top Glove Corporation BHD
- Hartalega Holdings BHD
- Careplus Group BHD
- Kossan Rubber Industries BHD
- Supermax Corporation BHD
Historical stock prices for the above firms and market returns as obtained from the FNM KLCI were collected from Yahoo Finance for the dates mentioned in section 3.1. The stock prices that were collected are the adjusted closing price of the specified days as the stock prices are adjusted for any stock splits that may have occurred. The model that is to be used for our study uses the returns of thestocks but only daily closing prices were available for the stocks and index. Natural logarithm is used instead of simple return to obtain an approximately constant variance which is an assumption required by our model. In order to obtain the stock returns (Rj,t from Eq.(1)) for our study, we use the formula below to convert the stock prices.
(5) ![\[R_{j,t}=ln \text{ } \frac{P_{j,t}}{P_{j,t-1}} \]](https://econsilience.ameuglobal.com/wp-content/ql-cache/quicklatex.com-0161a3459443a7f4fc0cb098893158d0_l3.png "Rendered by QuickLaTeX.com")
Where Pj,t is the price of stock j on day t.
Similarly, the market index will also be transformed using the same method to represent the average returns of all the firms that are included in the market index.
The data for the glove stock prices during the SARS outbreak differs from that of the data collected for the COVID-19 pandemic. The study analyses the stocks of five glove companies that are listed under the healthcare sector in Malaysia, however, only three out of the five companies were listed on the stock exchange during the SARS outbreak. The three companies that will be compared across the pandemics are:
- Top Glove Corporation BHD
- Kossan Rubber Industries BHD
- Supermax Corporation BHD
In the data, there were a number of missing days for the market index during the SARS period, thus causing our sample size to be smaller for all the event windows of our analysis. The change in the event windows are as illustrated in Table 3.
For section 3.3 of our methodology, the daily number of COVID-19 cases to-date in a day in Malaysia and globally were collected from the CEIC database. We also transform the data into a logarithmic change in the total number of positive cases using the same formula as shown in Eq. (5)
3.5 Summary Statistics
Table 2 presents the summary statistics of the stock prices of the Malaysian glove firms and the market index during the different periods of our study on the COVID-19 pandemic. It is evident from all 5 firms in Table 1 that the pandemic has had a significant effect on its stock prices. All 5 firms saw a large increase in its average stock price across both periods. Careplus Group Bhd. which is the smallest firm amongst the five in terms of market capitalisation, saw the biggest change in its average stock price of approximately 322% increase from the estimation period to the event period followed by another 320% increase in the post-event period. An important statistic to note from the table would be the average of the market index (FBM KLCI) which saw a 10% fall during the event period. This indicates that the average price of the other firms saw a significant fall in its prices on average. This could suggest that the abnormal returns of the glove stocks during the event period are high as the market is showing negative returns while the glove stock prices are increasing rapidly. In the post-event period however, the market index saw a significant improvement which indicates its recovery from the pandemic. This could mean that the abnormal returns of the stocks may not be apparent in the post-event period as the index representing all the other firms look as if they are recovering and generating positive returns.
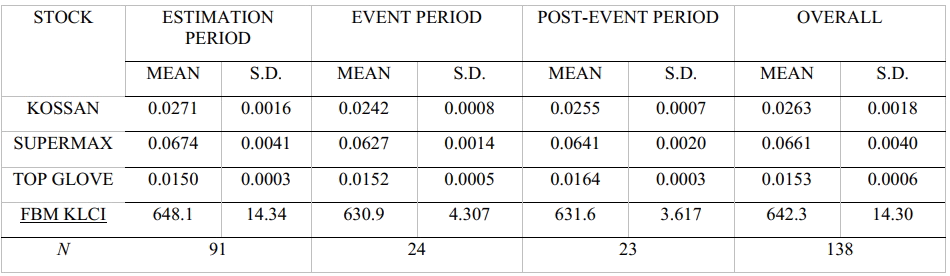
The summary statistics for the glove stock prices during the SARS outbreak (Table 3) portrays a very different outcome as compared to the summary statistics in Table 2. The glove stock prices for all 3 companies showed very small changes from the estimation period into the event period where Kossan and Supermax saw a fall in their mean stock prices. However, it is still possible to find significant abnormal returns in the period as the market index fell by a considerable amount across the two periods. The summary statistics for the change in the total number of cases locally and globally are presented in Table 4. A graph is also plotted in Figure 2 to examine the data. From Figure 2, we can see that there is a significant spike in the change of the total number of local cases but otherwise, it is closely linked together with the global cases.


4. RESULTS
The event study methodology was carried out on the glove stock prices and the results are as follows. The regression estimates that were obtained from Eq (1) for each firm is computed. However, the focus is not on the significance of the statistics or the model as the regression’s aim was to obtain coefficients for the following part of our analysis. The coefficients are then used to obtain the predicted returns of the stocks during the event period and the abnormal returns were calculated. Next, the cumulative abnormal returns are computed and tested for its significance and the results are as shown in Table 5 for the event window, day 0 to day 75, where day 0 represents the day of the event, 11th March 2020. Table 6 presents the results from the analysis of our abnormal returns in the post-event period (day 76 to day 150) and the entire period (day 0 to day 150) in Table 7.


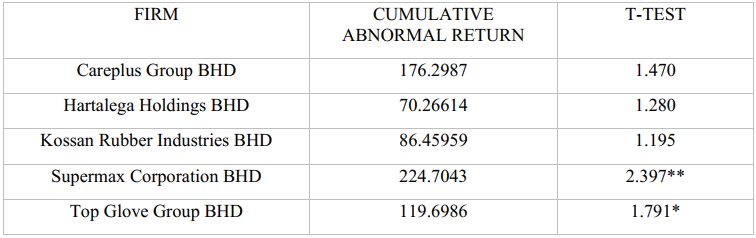
Based on the results in Table 5, we can see that the cumulative abnormal returns from Top Glove, Hartalega, Kossan and Supermax were all significant at a 10% level. Careplus however, presented insignificant cumulative abnormal returns from the t-test carried out. As mentioned in section 3, the significance level that is to be used is 5%, therefore the abnormal returns for Kossan are also statistically insignificant. Three out of the five firms reported cumulative abnormal returns that are different from zero which is consistent with our hypothesis that the COVID-19 pandemic has affected the stock returns of these glove companies. In table 6, the cumulative abnormal returns that were computed were statistically insignificant and are not different from zero for all 5 firms. This could mean that the announcement by the WHO and effectively the COVID-19 pandemic may not be the driving factor of the prices in the post-event period despite the rising stock prices. The cumulative abnormal returns were also calculated for the entire period of our study and found that stock returns for Supermax only were statistically significant from 0 at a 5% significance level, while Top Glove is significant at a 10% level.
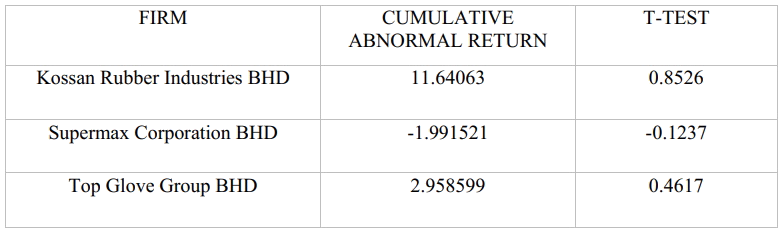
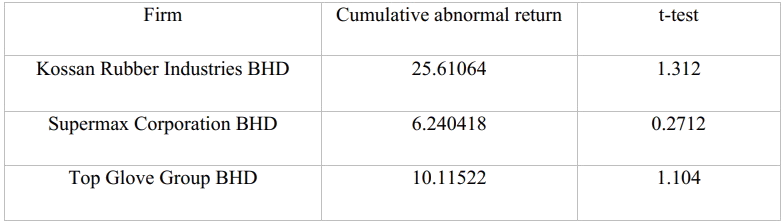
The results of the next part of our analysis which analyses the impact the SARS outbreak has on the stock prices are recorded in Tables 8, 9 and 10. The cumulative abnormal returns that were tested all proved to be statistically insignificant across the entire period of our study. The results indicate that the global alert from the WHO regarding the SARS outbreak did not have any significant impact on the glove stock returns during the outbreak which does not fall in line with our hypothesis that the health crisis would lead to positive and significant abnormal returns.

The results from the first part of the analysis will be used for further analysing. The abnormal returns that were obtained from the 3 firms that had statistically significant cumulative abnormal returns are regressed in the next model of our study (Eq(3)) and the estimates are shown in Table 10 and 11 below.


The estimates that were obtained when the abnormal returns were regressed against the change in the total number of local cases were robust at all significant levels for Top Glove and Supermax. However, the coefficient for the explanatory variables turned out to be negative. In other words, when the change in the total number of local COVID-19 cases falls by 1%, the abnormal returns for Top Glove and Supermax increases by 0.1436% and 0.1084% respectively. Based on Table 11, we also see that the abnormal returns computed for Hartalega stocks were statistically insignificant; hence, are not a function of the change in the total number of cases locally.
When we switched the explanatory variable to the change in the total number of global cases, the results differed substantially. The coefficient for the change in the total number of global cases was insignificant when regressed against the abnormal returns of Kossan glove stocks. In addition, the coefficients which were estimated for Supermax and Top Glove were only significant at the 10% significance level. At the 5% significance level, the coefficients are statistically insignificant for our study. The R-squared also fell for all firms when the explanatory variable was changed as seen in the table, indicating the change in total number of global cases have a smaller explanatory power. The results for this section suggests that the Malaysian glove stocks are indeed a function of the change in the total number of local cases (despite the unexpected negative correlation), however we could not say the same for the change in total number of global cases.
5. DISCUSSION
The event study methodology that was conducted on the glove stocks obtained the expected results for 3 out of the 5 firms that were included in our study during the event window (0,75). This effectively means that the announcement made by the WHO indeed had an impact on the stock returns for Top Glove, Supermax and Hartalega. Although the “event” in our study is the announcement by the WHO, the abnormal returns and the high price rises were not due to the announcement alone as the announcement is only used as a specific date that the COVID-19 pandemic started taking the world by storm.
Diving into how the pandemic has allowed the glove stocks to obtain abnormal returns during the period, we look at the firms’ primary products. The companies in the study are listed under the healthcare industry category on Bursa Malaysia’s website. The companies’ primary products are disposable examination gloves which are primarily used in hospitals by healthcare professionals. Due to the pandemic, hospitals from all over the world saw an influx of patients due to the contagious nature of the virus. Disposable medical products are a necessity to protect and prevent the virus from spreading. This includes examination gloves which are produced by the glove companies in our study. It also helps that 60% of the global glove supply comes from Malaysia; and since the pandemic has hit nearly every corner of the world, the demand for these products has been anticipated to increase tremendously (Zaugg, 2020).
However, as shown by the results, the cumulative abnormal returns during the event window for Kossan and Careplus were not statistically significant despite the latter having the highest cumulative abnormal returns as seen in Table 5. The result is unexpected as both companies produce similar products as the companies that had significant returns. Coincidentally, Kossan and Careplus have the lowest market capitalisation out of the 5 companies in our study, while it remains unclear as to why the pandemic seemed to have benefited the bigger companies more. The difference in production capacities could be a reason for the issue as stockholders may not have high confidence in the smaller firms hence, the returns are volatile due to a large amount of buy and sell. Results also show that all the firms showed insignificant cumulative abnormal returns in the post-event period. While the average stock price of the glove companies still rose by a massive amount as seen in Table 2, the cumulative abnormal returns were still insignificant. A plausible reason could be due to the rise of the market index in the post-event window. The increase in market index indicates that the average returns of the other companies in the stock market are also increasing as they may have recovered from the initial impact of the pandemic. Another plausible reason the abnormal returns may not be significant could be due to the news about vaccines being produced. The Pfizer BioNTech COVID-19 vaccine announced its first trials in April 2020 and in July 2020 (which affects our post-event period) announced Phase II-III which proved to be the pivotal trial (BioNTech, 2020). This may have caused unrest in glove stockholders causing many to sell as a precautionary measure.
In the following part of our analysis where we compared the glove stocks during the COVID-19 and the SARS outbreak respectively, insignificant results were obtained for our analysis of the SARS outbreak. Abnormal returns were expected from the glove stocks as the WHO announced a global alert regarding the disease, and we assumed that the demand for healthcare products would increase substantially. However, the results of the study were insignificant and it could possibly be due to the difference in magnitude of the two diseases. While there were already 117 cases of COVID-19 in Malaysia by the time the WHO declared the virus a global pandemic, only 5 cases of SARS were reported in Malaysia throughout the virus outbreak (WHO, 2015). Another reason may be the difference in the size of the glove companies 17 years prior to the COVID-19 pandemic. Evident from the difference in average stock prices from Table 2 and 3, the firms may not have had a large market share back in 2003 like they do now and therefore, could not reap the benefits of the health crisis.
The final part of our analysis is to analyse the significant abnormal returns obtained during the event period in our COVID-19 study that yielded unexpected significant results. The study surprisingly showed a negative correlation between the glove stocks’ abnormal returns and the change in the total number of local COVID-19 cases. The correlation does not make sense as one would assume that when the change in the total number of cases increases, the abnormal returns would also increase. The issue could have been caused by a flaw in the data collection as the Malaysian government announces the number of new cases in the evening, when the stock market closes. The results could potentially be different should the abnormal returns be regressed against the change in the total number of local cases from the previous trading day instead of the same day. When the change in total number of global cases is used , the results proved to be insignificant which makes sense as the glove stocks are traded in the Malaysian stock market, hence the local cases would probably have a larger impact on the stock returns.
6. CONCLUSION
The event study methodology has once again shown its effectiveness in analysing the effect of an event as we have obtained significant results despite having a large event window. This shows the methodology’s flexibility in analysing the impact of an event even in a longer event window instead of the smaller event window in which it is normally used. Our analysis on the glove stock prices during the SARS disease outbreak presented insignificant results which suggest that a health crisis may not necessarily affect the healthcare industry positively and it may require a crisis with a magnitude as large as that of the COVID-19 pandemic to positively affect the glove stock prices. Future research papers could conduct the study on every company listed under the healthcare sector in Malaysia in order to analyse whether the pandemic brought riches to the entire healthcare industry or solely to the rubber glove industry as we have shown in our study. Our analysis on the abnormal returns revealed unexpected results which can be seen as a point of improvement if such a study is conducted in the future. Despite showing significant results, our study is still flawed. In particular, the event study methodology, despite its reputation in most disciplines, also has its flaws. A large flaw of the study would be the assumption the methodology uses; where markets are efficient which is untrue as stock prices do not always reflect all available information affecting the firm which leads to inefficiency. This helps justify the insignificant results that were produced for the two firms. Secondly, it is difficult to predict the perfect window in our study. While in our study we used 150 days in an estimation period, it is possible that more observations are required to help us obtain significant results. Our event window of 75 days could also be too long or too short to capture the effect of our event in question which could have potentially affected results. Lastly, the model that we used to obtain our predicted returns may not have been the best choice as we used a simple OLS regression and perhaps other econometric methods could have better predicted different results.
While the flaws may seem apparent, it should not sway from the fact that the ESM has still allowed us to obtain significant results in our study. Many stockholders and traders who invested in glove stocks experienced an abundance of fortune during the pandemic. This study may be used for reference for stockholders and potential stock traders should another pandemic of a similar magnitude hit again. However, we should not disregard how the pandemic has negatively affected the rest of the world while some are lying in riches as an effect of the pandemic. Many lives were lost or heavily affected by the pandemic which is why it is important to emphasise that this study does not intend to shed a positive light on the pandemic. It would be interesting to conduct the same event study methodology on the same firms in the current period where vaccines have been authorised and administered globally. Perhaps the vaccine could bring the glove stock prices back down to earth after its astronomical rise due to the pandemic.
References
- Adda, J., 2016. Economic Activity and the Spread of Viral Diseases: Evidence from High Frequency Data*. The Quarterly Journal of Economics, 131(2), pp.891-941.
- Alam, M., Alam, M. and Chavali, K., (2020). Stock Market Response during COVID-19 Lockdown Period in India: An Event Study. The Journal of Asian Finance, Economics and Business, 7(7), pp.131-137.
- Bash, A., 2020. International Evidence of COVID-19 and Stock Market Returns : An Event Study Analysis. International Journal of Economics and Financial Issues, 10(4), pp.34-38.
- BioNTech, (2020), Update on our COVID-19 vaccine development program with BNT162b2
- Available at: https://investors.biontech.de/static-files/53f0968a-279b-4f82-a2fc-d67dcb6e4e91 (Accessed : 05 April 2021)
- Bunyan, J., (2020), PM: Malaysia under movement control order from Wed until March 31, all shops closed except for essential services. MalayMail, 16 March 2020 [online]. Available at : https://www.malaymail.com/news/malaysia/2020/03/16/pm-malaysia-in-lockdown-from-wed-until-march-31-all-shops-closed-except-for/1847204 [Accessed : 05 December 2020]
- Chen, M., Jang, S. and Kim, W., 2007. The impact of the SARS outbreak on Taiwanese hotel stock performance: An event-study approach. International Journal of Hospitality Management, 26(1), pp.200-212.
- Google Trends, (2020). Year in Search 2020 ; Global. Available at : https://trends.google.com/trends/yis/2020/GLOBAL/ [ Accessed : 1 December 2020]
- He, P., Sun, Y., Zhang, Y. and Li, T., (2020). COVID–19’s Impact on Stock Prices Across Different Sectors—An Event Study Based on the Chinese Stock Market. Emerging Markets Finance and Trade, 56(10), pp.2198-2212.
- International Monetary Fund (IMF), (2020). World Economic Outlook, April 2020 ; The Great Lockdown. Available at : https://www.imf.org/en/Publications/WEO/Issues/2020/04/14/weo-april-2020#Growth%20Projections%20Table [Accessed : 2 December 2020]
- Lee, J. W., & Brahmasrene, T. (2018). An Exploration of Dynamical Relationships between Macroeconomic Variables and Stock Prices in Korea. Journal of Asian Finance, Economics and Business, 5(3), 7-17.
- Loh, E., 2006. The Impact of SARS On the Performance and Risk-profile of Airline Stocks. International Journal of Transport Economics, [online] 33(3), pp.401-422. Available at: https://www.jstor.org/stable/42747811 [Accessed 2 December 2020].
- Malaysia. Department of Statistics, (2020). Report of Special Survey on Effects of COVID-19 on Companies and Business Firms. [online]
- Available at : https://www.dosm.gov.my/v1/index.php?r=column/cone&menu_id=RkJtOThJSlBJNStOV1liM1JsKzdZUT09 [Accessed 2 December 2020]
- Malaysia. Department of Statistics, (2020). Report of Special Survey on Effects of COVID-19 on Economy and Individuals.
- Available at : https://www.dosm.gov.my/v1/index.php?r=column/cone&menu_id=d3pnMXZ4ZHJjUnpnYjNyUnJhek83dz09 [Accessed 2 December 2020]
- Scott R. Baker & Nicholas Bloom & Steven J. Davis & Kyle J. Kost & Marco C. Sammon & Tasaneeya Viratyosin, 2020. “The Unprecedented Stock Market Impact of COVID-19,” NBER Working Papers 26945, National Bureau of Economic Research, Inc.
- Singh, B., Dhall, R., Narang, S. and Rawat, S., 2020. The Outbreak of COVID-19 and Stock Market Responses: An Event Study and Panel Data Analysis for G-20 Countries. Global Business Review, p.097215092095727.
- World Health Organization (WHO). (2020). WHO Director-General’s Opening Remarks At The Media Briefing On COVID-19 – 11 March 2020. [online] Available at: https://www.who.int/director-general/speeches/detail/who-director-general-s-opening-remarks-at-the-media-briefing-on-covid-19—11-march-2020 [Accessed 6 December 2020].
- World Health Organization (WHO), (2003a). WHO issues a global alert about cases of atypical pneumonia – 12 March 2020. [online] Available at : https://www.who.int/mediacentre/news/releases/2003/pr22/en/
- World Health Organization (WHO), (2003b). Update 96 – Taiwan, China: SARS transmission interrupted in last outbreak area. [online] Available at: https://www.who.int/csr/don/2003_07_05/en/ [Accessed 27 March 2021].
- World Health Organization (WHO). (2015). Summary of probable SARS cases with onset of illness from 1 November 2002 to 31 July 2003. [online] Available at: https://www.who.int/publications/m/item/summary-of-probable-sars-cases-with-onset-of-illness-from-1-november-2002-to-31-july-2003 [Accessed 28 March 2021].
- Worldometer, (2020). Coronavirus Death Toll. Available at : https://www.worldometers.info/coronavirus/coronavirus-death-toll/ [Accessed 4 December 2020]
- Zaugg, J., 2021. The world’s top suppliers of disposable gloves are thriving because of the pandemic. Their workers aren’t. [online] CNN Business. Available at: https://edition.cnn.com/2020/09/11/business/malaysia-top-glove-forced-labor-dst-intl-hnk/index.html [Accessed 24 March 2021].